If you’ve been following Bitcoin’s chart, you may have come across the Bitcoin Golden Cross term. One happened last week and it made lots of Bitcoin followers ask themselves – will Bitcoin’s price surge to new highs after the Golden Cross?
What Is a Golden Cross?
A golden cross is a term used when analyzing graphs. It shows a pattern in which the short-term moving average crosses the long-term moving average. Usually, for a short-term moving average is used 50 days period and for a long-term moving average 200 days period. Golden cross signals the potential positive breakthrough in price and is a highly bullish sign for traders.
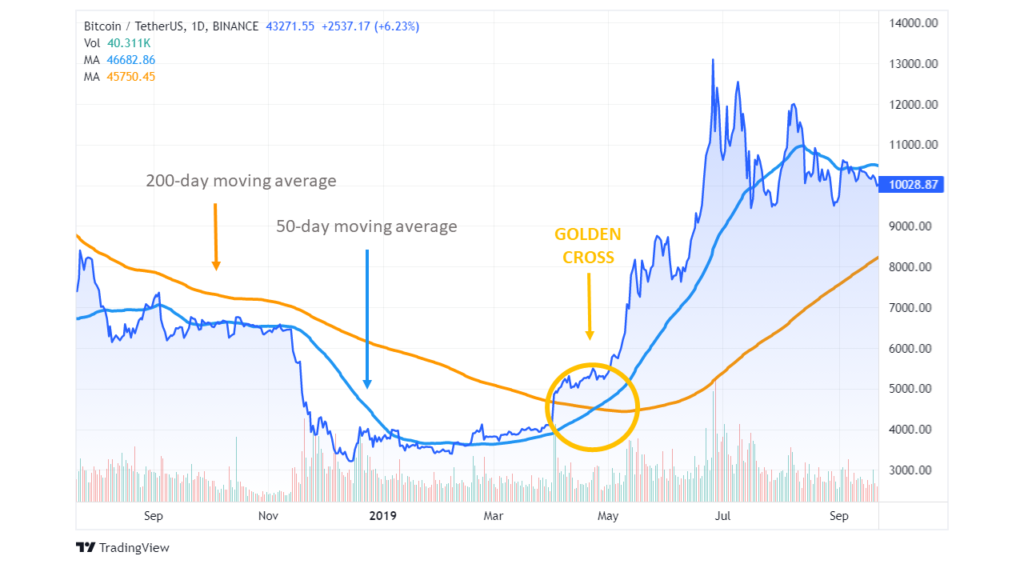
After Bitcoin golden cross in May 2019, Bitcoin’s price doubled in less than two months. It was a hell of an indicator of a new bull run.
Is Bitcoin Golden Cross a Reliable Indicator of price growth?
While the golden cross is considered a bullish indicator there are examples of times when Bitcoin price went considerably down after 50 days moving average crossed 200 days period. The most recent example happened just last week (see the picture below) when Bitcoin price soared 12% soon after the golden cross.

News about the potential collapse of China’s real estate company Evergrande Group together with the fear of the Fed’s reaction led to volatility in price movements. That made Bitcoin’s price go down even though a positive pattern just occurred.
Bitcoin’s price depends on many external factors which make the golden cross not an isolated indicator of price growth. In investing there are lots of factors that determine price movement. Simply following technical analysis is not enough to predict future movements. Therefore, the golden cross should be seen as one of many indicators of price movements, rather than as a single indicator of price growth.